Paper Money and Inflation: What €100 From 1999 Is Worth Today
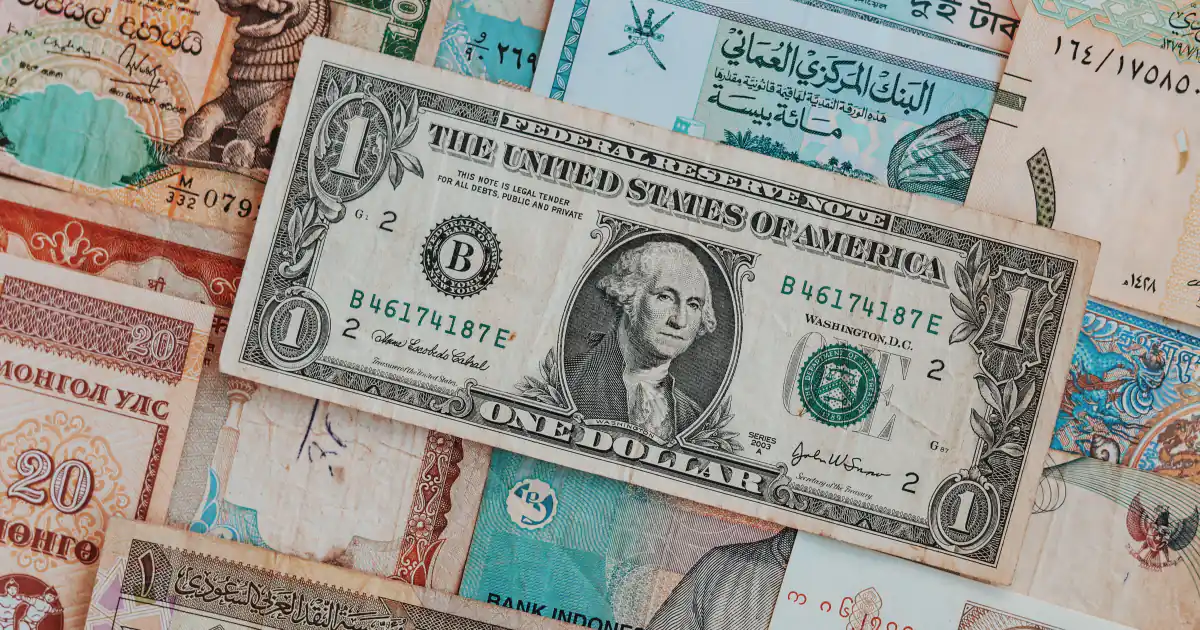
Online videos call paper money an illusion: ever since President Nixon cut the dollar’s link to gold in 1971, savings are said to lose five to ten percent a year, and the money flows to whoever receives it first. This study checks the history against sources and the numbers against our own data.
Key finding as of Aug 31, 2026: €57.50 (is what €100 from August 1999 buys in August 2026).
- €57.50is what €100 from August 1999 buys in August 2026
- 2.1%average yearly inflation in Germany since 1999
- 2 of 27years with inflation above 5%: 2022 and 2023
- €70.73purchasing power of €100 kept in an overnight account since January 2000
What the Story Claims
The story is easy to follow. Money used to be backed by gold, so governments could not print at will. On August 15, 1971, President Nixon ended that link, supposedly “temporarily.” Since then, the story goes, money has been backed by nothing and loses five to ten percent of its value every year. The lost purchasing power ends up with banks, the state and the wealthy, who receive new money first.
Some of this is true, and some is exaggerated. This study separates the two. It looks first at the gold standard and the events of 1971, then at the figures from our own series on inflation, savings accounts and house prices since 1999.
What the Gold Standard Was
The first half of the story is broadly right. In the 17th century, London goldsmiths issued receipts for gold left in their care, and these receipts soon changed hands as money. They turned into banknotes that the issuing bank had to redeem in gold. Under the classical gold standard, roughly from 1870 to 1914, this duty applied in the major economies.
Stable prices for a whole century, however, existed only on average. Over very long periods the price level moved around a fixed value, and average inflation was close to zero. From year to year, prices were less stable than today. Decades of falling prices, for example from the 1870s into the 1890s, alternated with periods of rising prices. Banking crises were more frequent. Falling prices hurt borrowers, because the real burden of their debt grew.
The link to gold also kept central banks from acting in a crisis. In the Great Depression of the 1930s, countries that left the gold standard earlier recovered earlier. Britain left in 1931. The United States moved to a new gold parity in 1933 and banned private ownership of gold coins and bars.
What Happened on August 15, 1971
After the Second World War, the Bretton Woods agreement (1944) set fixed exchange rates. Currencies were tied to the dollar, and the dollar to gold at $35 an ounce. Only the central banks of other countries could redeem dollars, not private citizens. Americans were not allowed to hold gold as an investment at the time anyway.
By the 1960s, more dollars were held abroad than the United States could have redeemed in gold. Under President de Gaulle, France converted large dollar holdings into gold from 1965 onward. In the summer of 1971, pressure on the dollar grew again. On Sunday, August 15, 1971, President Nixon announced on television that the conversion of dollars into gold would be suspended “temporarily.” The same evening he announced a 90-day freeze on wages and prices and a 10% surcharge on imports. The decisions had been made in the days before at Camp David, the president’s country retreat, away from the public.
It did not stay temporary. In December 1971, the major industrial countries devalued the dollar to $38 an ounce, and in February 1973 to $42.22. In March 1973 they gave up fixed rates. Since then, the major currencies have floated freely, and no central bank exchanges its money for gold on demand.
That does not make money worthless. Central banks still hold gold and other assets. Yet the value of the euro and the dollar rests on monetary policy, not on a vault. The European Central Bank aims to keep inflation at 2% over the medium term. Whether it succeeds can be measured.
What Inflation Has Cost Since 1999
The claim that savings lose five to ten percent a year can be tested against official price data. Since the euro was introduced in 1999, inflation in Germany was above 5% in only two years: 8.6% in 2022 and 6.1% in 2023, after energy prices jumped. In the other 25 years it stayed below that, with a low of 0.2% in 2009. There was no full year of falling prices.
Loading figure …
The loss is still not small, because it adds up. On average, prices rose by 2.07% a year. Over 27 years, that means a 42.5% loss of purchasing power. A €100 note put in a drawer in August 1999 bought only as much in August 2026 as €57.50 did at the start.
This average is very close to the central bank’s target. For cash and accounts that pay no interest, however, a 2% target means exactly that: a planned loss of about one fifth of purchasing power every ten years.
What Savers Lost
Money kept in an overnight account earns interest. In our data, the average rate was 0.72% a year. Inflation over the same period averaged 2.08%. €100 placed in an overnight account at the average market rate in January 2000 grew to €121.03 by August 2026. In purchasing power, it was worth only €70.73.
Loading figure …
Interest made up for inflation only in a few periods. After the financial crisis, rates on deposits fell toward zero and stayed there until 2022, while prices kept rising. For savers with accounts, that meant a steady loss in real terms, whether it is called a tax, an expropriation or monetary policy.
Where the Purchasing Power Goes
Around 1730, the Irish-French banker Richard Cantillon wrote his “Essai sur la nature du commerce en général.” In it he describes how new money does not raise prices everywhere at once. It first has an effect where it enters the economy. Those who receive it early still buy at old prices. Those who receive it late already pay the higher ones. Economists today call this the Cantillon effect.
Research does not dispute that monetary policy affects how wealth is distributed. How large the effect is remains debated. Our data shows one trace of it: since 2005, prices of residential property in Germany rose by 82%, consumer prices by 59%.
Loading figure …
This does not prove the story. House prices also depend on interest rates, population, land and building costs. When rates rose, the index fell by 13% from the second quarter of 2022 to the first quarter of 2024. A price index also does not measure an owner’s return. Purchase costs, upkeep and financing are missing, and a single house can move quite differently from the index.
What the Data Shows
Three statements hold up. First, the loss of purchasing power is no myth: since 1999, the euro has lost 42.5% of its purchasing power in Germany, a little over 2% a year on average. Second, savers with overnight accounts lost in real terms, because interest mostly stayed below inflation. Third, real assets such as residential property rose faster than consumer prices over this period.
Three parts of the story do not hold up. Inflation of five to ten percent a year occurred only in 2022 and 2023, not as a rule. The gold standard did not bring calm prices but long periods of falling prices and frequent crises. And 1971 was no robbery in the night. The dollar’s gold link could no longer be held by the 1960s, and it ended in several steps until 1973.
Data and Method
- Inflation: the Harmonized Index of Consumer Prices (HICP) for Germany from Eurostat, year-on-year rates for every month from January 1999 to August 2026. The price level is built by chaining these rates, with the twelve months of 1999 as the base. Purchasing power is its inverse.
- Inflation per calendar year: the mean of its twelve year-on-year rates. The average over the whole period (2.07%) is the geometric mean of the price level from August 1999 to August 2026.
- Overnight deposits: the ECB interest rate statistics for overnight deposits of households in Germany, January 2000 to August 2026, credited monthly, before tax. Individual offers were at times much higher.
- House prices: Eurostat’s residential property price index for Germany, quarterly from the first quarter of 2005 to the second quarter of 2026, both series set to 100 in the first quarter of 2005. The index measures prices, not rents or costs.
- The historical account relies on primary sources: the Bretton Woods agreement (1944), President Nixon’s televised address of August 15, 1971, and the International Monetary Fund’s records on the end of fixed exchange rates (1973). All figures as of August 31, 2026.
Every figure comes from our own price database and is produced by a script in the repository. Running it again with the same cutoff date returns the same numbers. Not investment advice.